

I. Introduction to Python for Data
A. What is Python?
Python is a versatile and powerful programming language that has gained immense popularity in the world of data analysis. It is known for its simplicity and readability, making it a preferred choice for both novice and experienced programmers. Some common features that contribute to Python’s popularity among data analysts include:
- Ease of Learning: Python’s syntax is clear and straightforward, allowing new users to quickly pick it up.
- Extensive Libraries: A rich collection of libraries enhances functionality, covering a wide array of tasks in data manipulation, visualization, and statistical analysis.
- Community Support: An active community ensures that you can find help, resources, and tutorials easily.
When compared to other languages like R, SQL, or Java, Python stands out due to its versatility. While R is excellent for statistical analysis and visualizations, Python is ideal for data handling and integration with various other tasks.
B. Why Use Python for Data Analysis?

There are many compelling reasons to choose Python for data analysis:
- Versatility: Python can be used for web development, software development, and automating tasks alongside data analysis.
- Popular Libraries: Libraries like NumPy, Pandas, and Matplotlib provide streamlined ways to perform complex data tasks.
- Real-world Application: From finance to healthcare, Python is used to uncover insights from data, automate processes, and improve operational efficiency.
Industries across the board, including social media analytics, e-commerce platforms, and scientific research, rely on Python due to its robust capabilities.
C. Getting Started with Python
Starting your journey with Python is relatively straightforward:
- Installation: Download Python from the official website (python.org). Installation is available for Windows, macOS, and Linux. Most systems may come with Python pre-installed, but it’s good practice to check for the latest version.
- Development Environment: Popular Integrated Development Environments (IDEs) include Jupyter Notebook (great for data analysis and visualization), PyCharm, and Visual Studio Code. Choose one that feels comfortable for you.
- Basic Syntax: Familiarize yourself with Python’s basic syntax. For instance, understanding variables, data types, loops, and conditional statements will lay the foundation for more complex tasks.
II. Essential Python Libraries for Data Analysis
A. Numpy: The Foundation for Numerical Data
NumPy is a powerful library that lays the groundwork for numerical data manipulation in Python.
- Role in Data Manipulation: It provides support for large multidimensional arrays and matrices, along with a collection of mathematical functions to operate on these arrays.
- Functionality: Some key methods include
np.array(),np.mean(), andnp.std(), which help in mathematical operations. - Case Study: If you have a dataset of temperatures, you can use NumPy to calculate the average temperature simply with:
import numpy as np temperatures = np.array([20, 22, 19, 23]) avg_temp = np.mean(temperatures) print(avg_temp) # Output: 21.0

B. Pandas: Data Manipulation Made Easy
Pandas is indispensable for data analysis, specifically for manipulating structured data.
- Significance: It provides data structures like Series and DataFrames, making it easy to handle data in a tabular format.
- Key Features: Data cleaning and reshaping are simplified with functions for filtering, aggregating, and transforming data.
- Case Study: When analyzing sales data, you might use Pandas to load a CSV and calculate total sales like this:
import pandas as pd sales_data = pd.read_csv('sales.csv') total_sales = sales_data['Sales'].sum() print(total_sales)

C. Matplotlib and Seaborn: Data Visualization Tools
With data in hand, visualizing it is the next crucial step. Here’s where Matplotlib and Seaborn come in.
- Matplotlib: This library allows you to create static, interactive, and animated visualizations. Basic plotting can be done with:
import matplotlib.pyplot as plt plt.plot([1, 2, 3], [4, 5, 6]) plt.show()

- Seaborn: Built on top of Matplotlib, Seaborn simplifies beautiful statistical graphics with less code.
- Case Study: To visualize sales data distributions, you might use Seaborn:
import seaborn as sns sns.histplot(sales_data['Sales']) plt.show()

III. Data Preparation Techniques
A. Data Cleaning and Preprocessing
The foundation of any data analysis is clean data. Without appropriate cleaning, insights can be misleading.
- Importance of Data Cleaning: Data often comes with missing values or duplicates, which can skew results. Cleaning ensures data accuracy.
- Techniques: For handling missing values, you can fill them in or remove records with
Pandas. - Practical Example: Removing duplicates in a DataFrame:
cleaned_data = sales_data.drop_duplicates()
B. Data Transformation and Normalization
Transforming data helps in preparing it for analysis.
- Explanation: Techniques like normalization (adjusting values to a common scale) or scaling (adjusting ranges) can improve outcomes, especially for machine learning.
- When to Apply: These techniques are crucial when datasets vary significantly in scale.
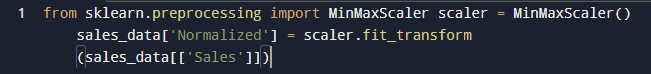
- Hands-on Example: Normalizing a column can be done using:
from sklearn.preprocessing import MinMaxScaler scaler = MinMaxScaler() sales_data['Normalized'] = scaler.fit_transform(sales_data[['Sales']])
C. Merging and Concatenating Data
Often, data comes from various sources and needs to be combined.
- Methods: Pandas provides several ways to join datasets, such as
merge()for inner and outer joins. - Understanding Joins: An inner join returns only matched records, while an outer join returns all records from both datasets.
- Use Cases: Combining customer and sales data allows for a more holistic view of performance.
IV. Analyzing Data with Python
A. Descriptive Statistics and Summary Functions
Descriptive statistics give you a quick overview of your data’s characteristics.
- Overview: Measures like mean, median, mode, and standard deviation summarize key aspects of datasets.
- Calculating Statistics: You can easily compute these using Pandas:
summary_stats = sales_data.describe() print(summary_stats)
B. Exploring Relationships in Data
Analyzing correlations and trends unveils deeper insights.
- Techniques: Scatter plots, pair plots, and regression analysis are effective for understanding relationships.
- Example: Using a scatter plot to see sales versus advertising spend:
sns.scatterplot(data=sales_data, x='Advertising', y='Sales') plt.show()
C. Implementing Statistical Tests
Understanding data means not only observing but also testing hypotheses.
- Introduction to Hypothesis Testing: This method allows us to test assumptions about our data.
- Overview of Common Tests: T-tests, chi-squared tests, and ANOVA help in making informed decisions.
- Application Example: Performing a t-test to compare means between two groups can be done with SciPy:
from scipy import stats t_stat, p_value = stats.ttest_ind(group1_data, group2_data)
V. Advanced Data Analysis Techniques
A. Introduction to Machine Learning with Python
Machine learning brings data analysis to the next level, allowing for predictions and insights.
- Overview: Concepts like supervised and unsupervised learning help explore data patterns.
- Popular Libraries: Libraries such as scikit-learn and TensorFlow offer tools for implementing machine learning algorithms.
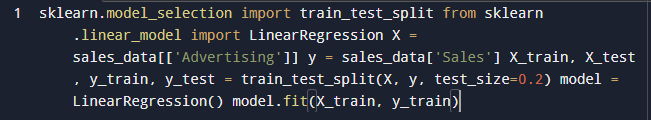
- Case Study: Building a simple predictive model to forecast sales based on historical data can be done like this:
from sklearn.model_selection import train_test_split from sklearn.linear_model import LinearRegression X = sales_data[['Advertising']] y = sales_data['Sales'] X_train, X_test, y_train, y_test = train_test_split(X, y, test_size=0.2) model = LinearRegression() model.fit(X_train, y_train)
B. Time Series Analysis with Python
Time series data often has unique characteristics that require specialized analysis.
- Understanding Time Series: This type of data is crucial for forecasting trends, like stock prices or sales over time.
- Techniques: Methods like trend analysis or seasonal decomposition provide insights into cyclic patterns.
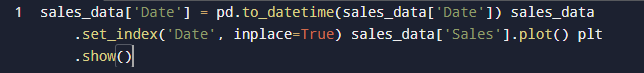
- Example Project: Analyzing sales trends over the last year can highlight seasonal peaks:
sales_data['Date'] = pd.to_datetime(sales_data['Date']) sales_data.set_index('Date', inplace=True) sales_data['Sales'].plot() plt.show()
C. Incorporating Big Data Technologies
As datasets grow, big data technologies become essential.
- Overview of Big Data: Understanding how to manage large datasets with tools like Hadoop or Spark can expand your capabilities.
- Introduction to Tools: PySpark offers a Python API for Spark, allowing for big data analysis.
- Practical Considerations: When dealing with big data, efficient data management and optimization techniques are crucial.
VI. Conclusion
To wrap up, we’ve walked through the essential aspects of using Python for effective data analysis, from getting started and data preparation to advanced techniques like machine learning and big data integration. Remember, the world of data analysis is vast and ever-evolving. Continuous learning and practice are key to becoming proficient. As you progress, don’t hesitate to explore additional resources, take on personal projects, and engage with community challenges to keep your skills sharp.
VII. FAQs
- What are the prerequisites for learning Python for data analysis?
- A basic understanding of programming concepts and statistics is helpful but not mandatory.
- How long does it take to learn Python for data analysis?
- The time varies based on your background and dedication; however, many find they can become proficient in several months with consistent practice.